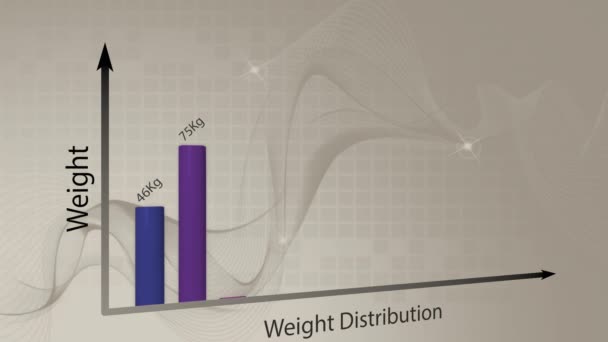
Bar graph forms data distribution as it summarizes generic performance. Designers can use almost any data message they choose. — 스톡 푸티지

Bar graph forms data distribution as it summarizes generic performance. Designers can use almost any data message they choose.

 — kelpfish의 비디오
  • kelpfish
    작가kelpfish
  • 634900836
  • 비슷한 비디오 찾기
  • 길이: 00:20화면 비율: 16:9

동일 시리즈:

Plain horizontal infographic bar graph summarizes data performance in a generic fashion, allowing for placement of text or other design elements
Plain Horizontal Infographic Bar Graph Summarizes Data Performance Generic Fashion — 비디오
An animated bar chart on alpha layer allows designers to place it over any background they wish.
Animated Bar Chart Alpha Layer Allows Designers Place Any Background — 비디오
Plain horizontal infographic bar graph summarizes data performance in a generic fashion, allowing for placement of text or other design elements
Plain Horizontal Infographic Bar Graph Summarizes Data Performance Generic Fashion — 비디오
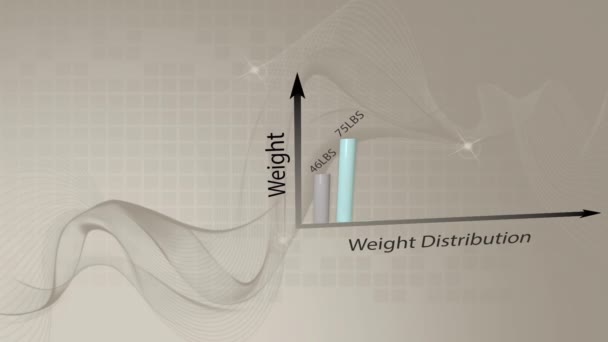
Bar graph forms results as it summarizes weight distribution
Bar Graph Forms Results Summarizes Weight Distribution — 비디오
Bar graph forms results as it summarizes weight distribution
Bar Graph Forms Results Summarizes Weight Distribution — 비디오
An animated pie chart slowly fills in with patterns of data and can be used for most financial and data related messaging. Room for placement of text or other elements.
Animated Pie Chart Slowly Fills Patterns Data Can Used Most — 비디오
Line graph forms data distribution as it summarizes generic performance. Designers can use almost any data message they choose.
Line Graph Forms Data Distribution Summarizes Generic Performance Designers Can — 비디오
Area graph forms data distribution as it summarizes generic performance. Designers can use almost any data message they choose.
Area Graph Forms Data Distribution Summarizes Generic Performance Designers Can — 비디오
An animated pie chart slowly fills in with patterns of data and can be used for most financial and data related messaging. Room for placement of text or other elements.
Animated Pie Chart Slowly Fills Patterns Data Can Used Most — 비디오
An animated Venn diagram slowly populates with the characteristics needed to create product demand.
Animated Venn Diagram Slowly Populates Characteristics Needed Create Product Demand — 비디오
An animated pie chart slowly fills in with patterns of data and can be used for most financial and data related messaging. Room for placement of text or other elements.
Animated Pie Chart Slowly Fills Patterns Data Can Used Most — 비디오
An animated ring chart slowly fills in with patterns of data and can be used for most financial and data related messaging. Room for placement of text or other elements.
Animated Ring Chart Slowly Fills Patterns Data Can Used Most — 비디오
A 3D high technology robot arm moving in various positions poised against a grid background.
High Technology Robot Arm Moving Various Positions Poised Grid Background — 비디오

사용 정보

표준 라이센스에 따라 이 로열티-프리 "Bar graph forms data distribution as it summarizes generic performance. Designers can use almost any data message they choose." 비디오를 개인적 및 상업적 목적으로 사용할 수 있습니다. 표준 라이센스는 웹사이트와 앱의 광고 및 UI 디자인을 비롯한 대부분의 사용을 커버합니다.

이 스톡 푸티지 구입 시 최대 1920x1080 의 고해상도로 다운로드할 수 있습니다.